The quickest way to start debugging in MPS is the following:
We are using com.dslfoundry.plaintextgen as an example.
Please be advised that in (possibly earlier) generic distribution versions of MPS, the debugger doesn’t work. You will have to really use one of the dedicated distributions (Mac, Linux, or Windows).
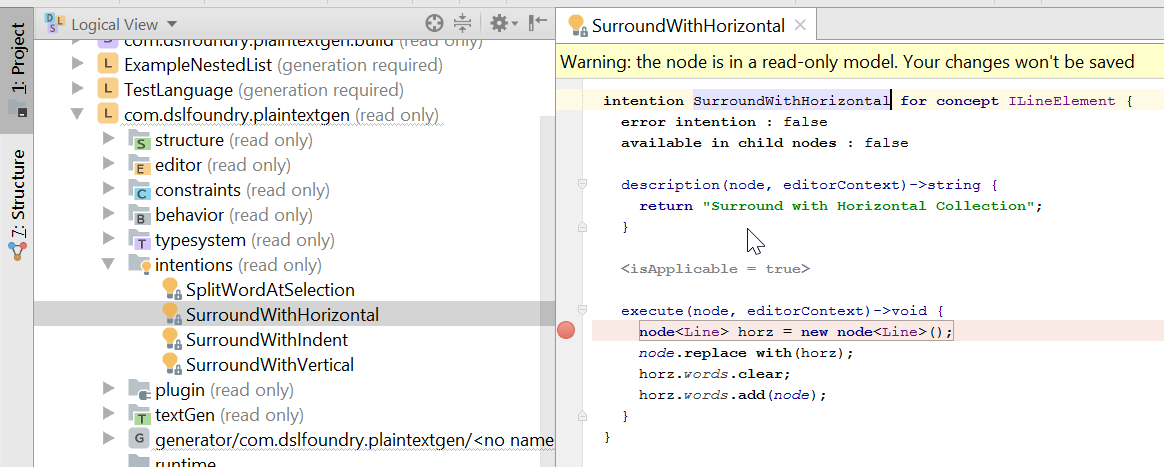
Choose your breakpoint by clicking in the gutter:
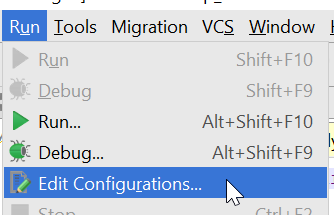
Select Run –> Edit Configurations from the main menu:
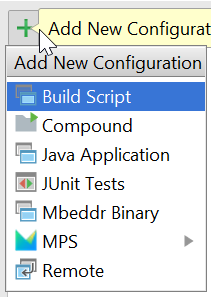
Press + to choose from the list of new configuration types to add:
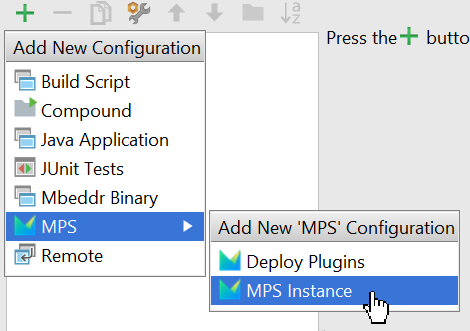
Choose MPS –> MPS Instance:
Check Open current project:

Type your own name for the run configuration (I chose MPSInstance):

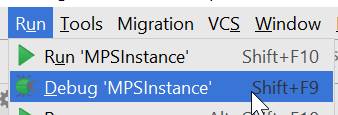
Press OK to close the Run configuration screen and then select Run –> Debug MPSInstance from the main menu:
Now a second instance of MPS will be started (click away all the startup screens that come in).
With the given breakpoint, let’s inspect variables:
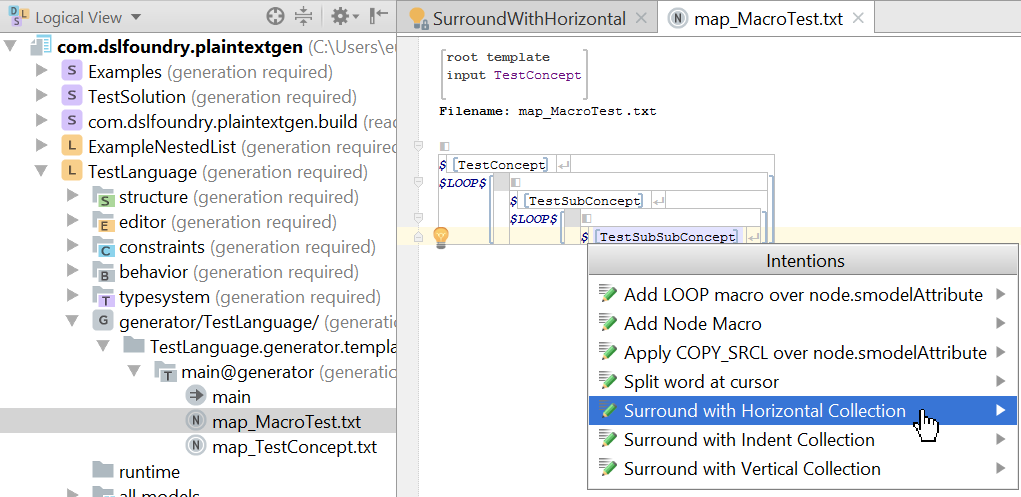
- Trigger the code with the breakpoint by executing the Surround with Horizontal Collection intention:
- Now the MPS instance is going to freeze, because the debugger paused it at the breakpoint. Go back to the original MPS window from where you started the debug session and view variables:

Tip: enable toolbar for having convenient debug buttons. You can do this by selecting View –> Toolbar from the main menu.